

CCR vs. S&P and Fitch: Rating Distribution
The chart below shows a comparison of Credit Benchmark CCR against S&P and Fitch ratings across 5,000+ entities. Each point represents a rating pair: one CCR value and one agency rating for the same entity at the same point in time. Bubble size reflects the number of entities in each combination.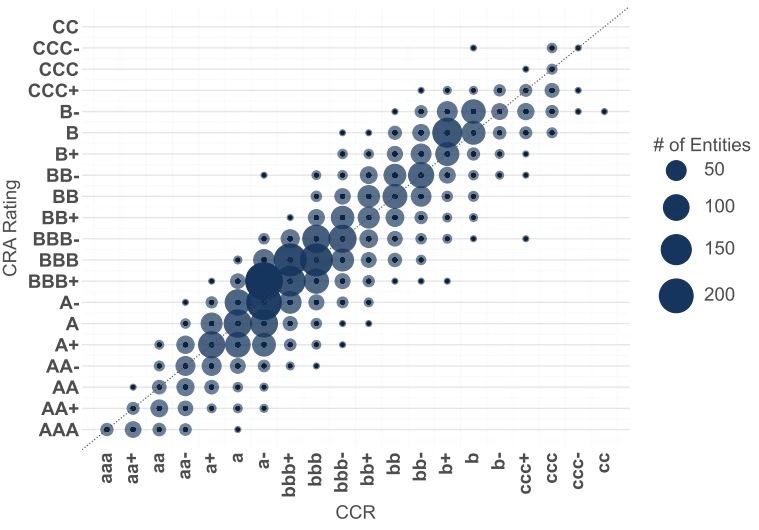
CCR (x‑axis) vs agency rating (y‑axis). The y‑axis label 'CRA' in the chart refers to Credit Rating Agency, specifically S&P and Fitch in this comparison. Points near the diagonal indicate close agreement.
Why alignment occurs
- The Credit Benchmark scale is aligned to rating agency categories by construction: the CB rating scale is calibrated from banks’ own internal grade-to-agency mappings. Contributing banks map their internal grades to agency-style categories (AAA, BBB, etc.), and the CB scale is built from the average of those mappings. Agency comparability is built into Credit Benchmark’s PD to CCR scale.
- Banks and agencies respond to the same risk drivers: bank credit models and agency analysts assess the same underlying fundamentals. Their views naturally converge toward similar levels for most entities.
- Consensus aggregation flattens idiosyncratic variation: CCR pools 40+ banks’ views. Differences in individual bank frameworks tend to average out, leaving the signal closer to the market consensus.
CCR is typically directionally and level-wise comparable to S&P and Fitch, while remaining an independent, higher-frequency signal that can identify shifts in perceived risk ahead of published agency actions.