> ## Documentation Index
> Fetch the complete documentation index at: https://docs.creditbenchmark.com/llms.txt
> Use this file to discover all available pages before exploring further.
# Accuracy & Coverage
> Performance benchmarks for Credit Benchmark entity resolution: precision, recall, and coverage metrics measured on a held-out evaluation set.
## Dataset
Performance is measured on a held-out set of entity names — names deliberately excluded from training so the model has never seen them. This ensures evaluation reflects generalisation, not memorisation.
For each name, the retrieval stage returns \~25 candidates from the CB database. Performance is measured at the **candidate-pair level** — each name–candidate combination is one labelled example.
| | Value |
| -------------------------- | ----------------------------------- |
| Held-out entity names | **1,544** |
| Labelled candidate pairs | **39,051** |
| Avg. candidates per entity | **25.3** |
| True-match pairs | **1,544** |
| Non-match pairs | **37,507** |
| Class balance | **\~24 non-matches per true match** |
Because only one candidate per name is correct, the dataset is heavily imbalanced — mirroring the real-world distribution the model encounters in production. Performance is re-evaluated with each weekly retraining cycle.
## Confusion Matrix
**What it measures:**
The [confusion matrix](https://en.wikipedia.org/wiki/Confusion_matrix) evaluates the model as a binary classifier at threshold $\hat{p} \geq 0.60$. Candidates above the threshold are predicted as matches; all others as non-matches.
**Result:**
**83.61%** of actual matches correctly identified
**0.29%** of actual non-matches incorrectly flagged
**16.39%** of actual matches below threshold — surfaced for review
**99.71%** of actual non-matches correctly rejected
Two metrics are derived from these counts:
**Recall: what fraction of true matches did the model correctly identify?**
* Of the 1,544 true matches in the test set, 1,291 scored above threshold. $\text{Recall} = \frac{T_p}{T_p + F_n} = \frac{1{,}291}{1{,}291 + 253} = 83.6\%$
* The 253 false negatives represent matches that were scored below the 0.6 confidence threshold.
* In practice, Credit Benchmark finds that the true match is still surfaced in the result set — even when the confidence for the correct match is lower than 0.6.
**F1 Score: what is the model's combined performance across recall and precision?**
* F1 is the harmonic mean of Recall and Precision — it penalises imbalance between the two, rewarding models that perform well on both. $F_1 = \frac{2T_p}{2T_p + F_p + F_n} = \frac{2 \times 1{,}291}{2 \times 1{,}291 + 110 + 253} = 87.7\%$
* An F1 of 87.7% reflects strong overall classification performance at the 0.60 threshold — the model recovers the large majority of true matches while producing few incorrect predictions.
## ROC Curve & Precision–Recall
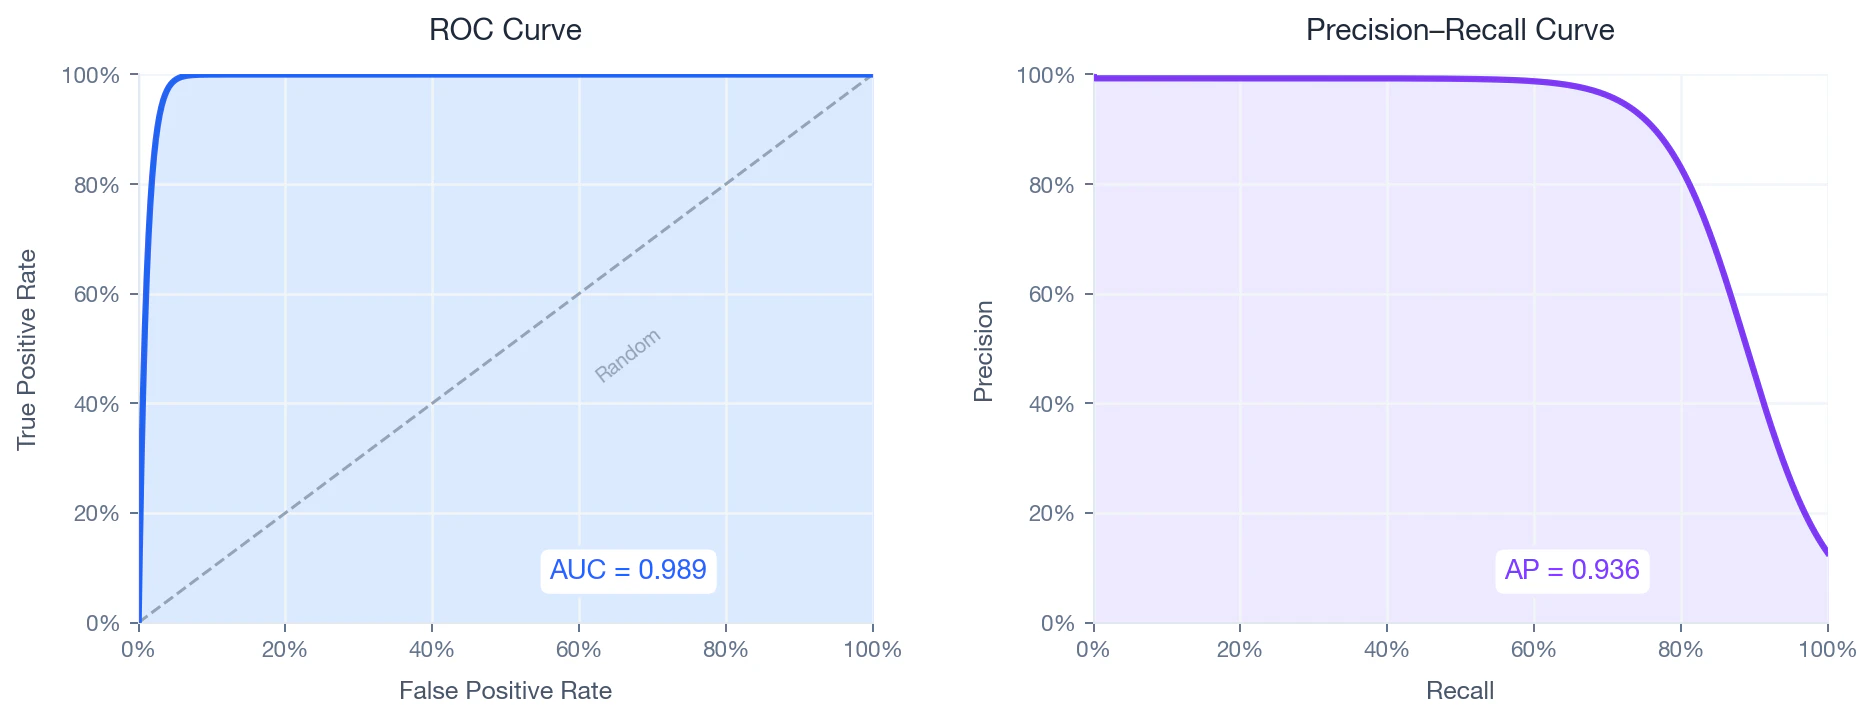
Because the dataset is heavily imbalanced (\~24:1), the Precision–Recall curve is the more informative diagnostic — [ROC AUC can be misleadingly optimistic in imbalanced settings](https://en.wikipedia.org/wiki/Receiver_operating_characteristic#Limitations).
 ### ROC Curve
**What it measures:** how well the model separates matches from non-matches across all possible thresholds. The [ROC curve](https://en.wikipedia.org/wiki/Receiver_operating_characteristic) plots True Positive Rate against False Positive Rate as the threshold sweeps from 1 to 0:
* $\text{TPR} = \frac{T_p}{T_p + F_n}, \qquad \text{FPR} = \frac{F_p}{F_p + T_n}$
The area under this curve (AUC) summarises discriminative performance — 1.0 is perfect, 0.5 is no better than random.
**Result:** AUC = **0.989** — near-perfect separation between true matches and non-matches.
### Precision–Recall Curve
**What it measures:** how much precision the model retains as it recovers more matches. [Average Precision (AP)](https://en.wikipedia.org/wiki/Evaluation_measures_\(information_retrieval\)#Average_precision) summarises this as the weighted area under the PR curve:
* $\text{Average Precision} = \sum_{n} (R_n - R_{n-1}) \cdot P_n$
where:
* $R_n$ — recall at threshold step $n$
* $P_n$ — precision at threshold step $n$
AP is more meaningful than AUC when positive examples are rare — AP = 1.0 is perfect.
**Result:** AP = **0.936** — strong precision maintained across most of the recall range.
## Precision–Coverage Trade-off
**What it measures:**
[Precision](https://en.wikipedia.org/wiki/Precision_and_recall) is the share of predicted matches that are actually correct. Coverage is the share of input names that receive a match above threshold $k$:
* $\text{Precision}(k) = \frac{T_p}{T_p + F_p}, \qquad \text{Coverage}(k) = \frac{n_{\geq k}}{N}$
where:
* $n_{\geq k}$ — number of names scoring at or above $k$
* $N$ — total number of input names
As threshold $k$ changes:
* **Raising** $k$ — fewer names matched, higher precision, lower coverage
* **Lowering** $k$ — more names matched, lower precision, higher coverage
An [operating point](https://scikit-learn.org/stable/auto_examples/model_selection/plot_precision_recall.html) is the specific (Coverage, Precision) pair at your chosen threshold — the point on the curve where you decide to operate.
**Result:**
### ROC Curve
**What it measures:** how well the model separates matches from non-matches across all possible thresholds. The [ROC curve](https://en.wikipedia.org/wiki/Receiver_operating_characteristic) plots True Positive Rate against False Positive Rate as the threshold sweeps from 1 to 0:
* $\text{TPR} = \frac{T_p}{T_p + F_n}, \qquad \text{FPR} = \frac{F_p}{F_p + T_n}$
The area under this curve (AUC) summarises discriminative performance — 1.0 is perfect, 0.5 is no better than random.
**Result:** AUC = **0.989** — near-perfect separation between true matches and non-matches.
### Precision–Recall Curve
**What it measures:** how much precision the model retains as it recovers more matches. [Average Precision (AP)](https://en.wikipedia.org/wiki/Evaluation_measures_\(information_retrieval\)#Average_precision) summarises this as the weighted area under the PR curve:
* $\text{Average Precision} = \sum_{n} (R_n - R_{n-1}) \cdot P_n$
where:
* $R_n$ — recall at threshold step $n$
* $P_n$ — precision at threshold step $n$
AP is more meaningful than AUC when positive examples are rare — AP = 1.0 is perfect.
**Result:** AP = **0.936** — strong precision maintained across most of the recall range.
## Precision–Coverage Trade-off
**What it measures:**
[Precision](https://en.wikipedia.org/wiki/Precision_and_recall) is the share of predicted matches that are actually correct. Coverage is the share of input names that receive a match above threshold $k$:
* $\text{Precision}(k) = \frac{T_p}{T_p + F_p}, \qquad \text{Coverage}(k) = \frac{n_{\geq k}}{N}$
where:
* $n_{\geq k}$ — number of names scoring at or above $k$
* $N$ — total number of input names
As threshold $k$ changes:
* **Raising** $k$ — fewer names matched, higher precision, lower coverage
* **Lowering** $k$ — more names matched, lower precision, higher coverage
An [operating point](https://scikit-learn.org/stable/auto_examples/model_selection/plot_precision_recall.html) is the specific (Coverage, Precision) pair at your chosen threshold — the point on the curve where you decide to operate.
**Result:**
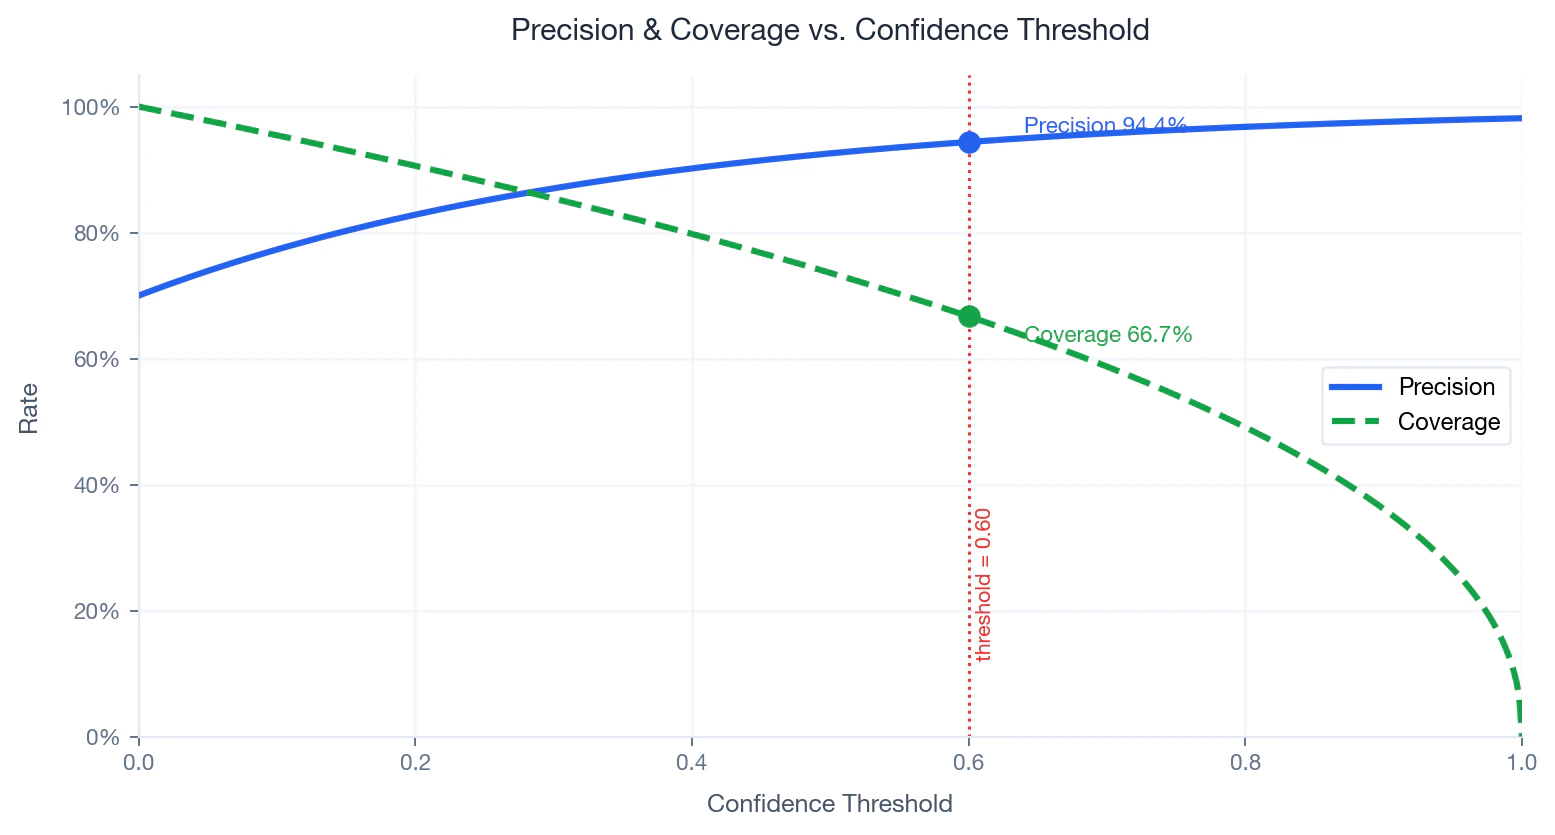 At the operating point $\hat{p} = 0.60$: precision is **94.4%** and coverage is **66.7%**. Two-thirds of names receive a high-confidence match; the remaining third fall below threshold and require review.